
 Numbers don’t lie, but how you understand the numbers, all of them, can make a difference. The map I recently saw on Facebook expressed the believe that there were small islands of people voting blue. I cannot speak for all of the red parts of the map, but I can give an example that should make you wary of any such claims.
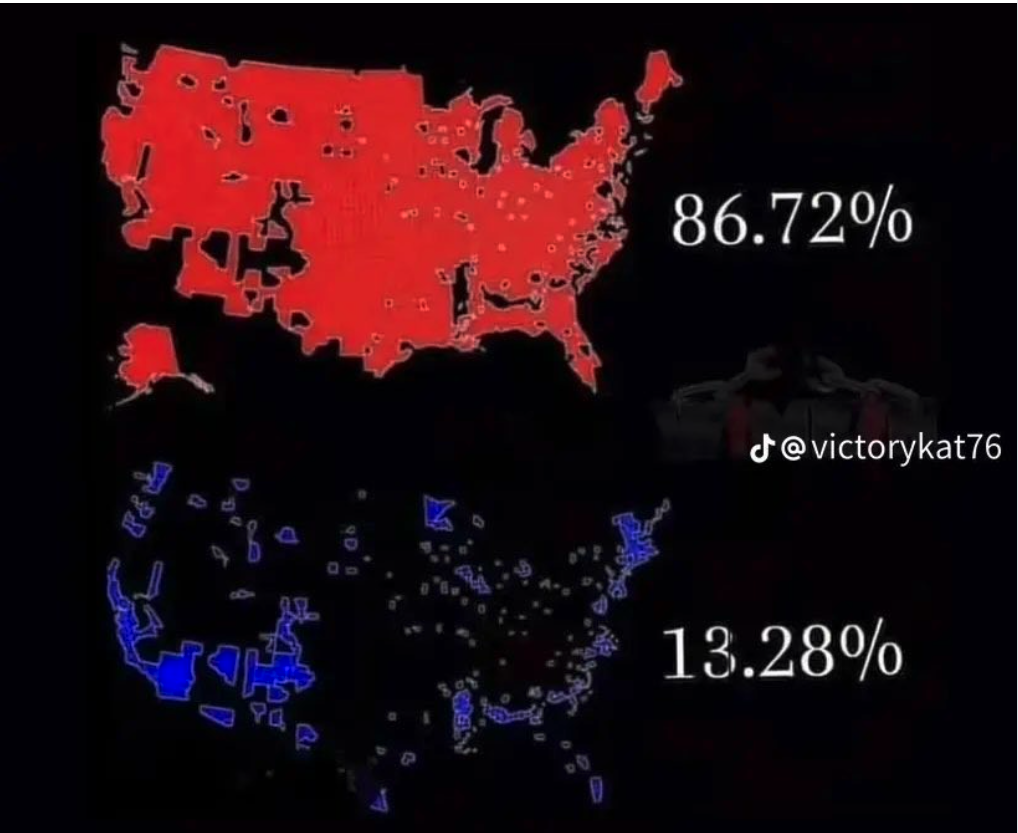
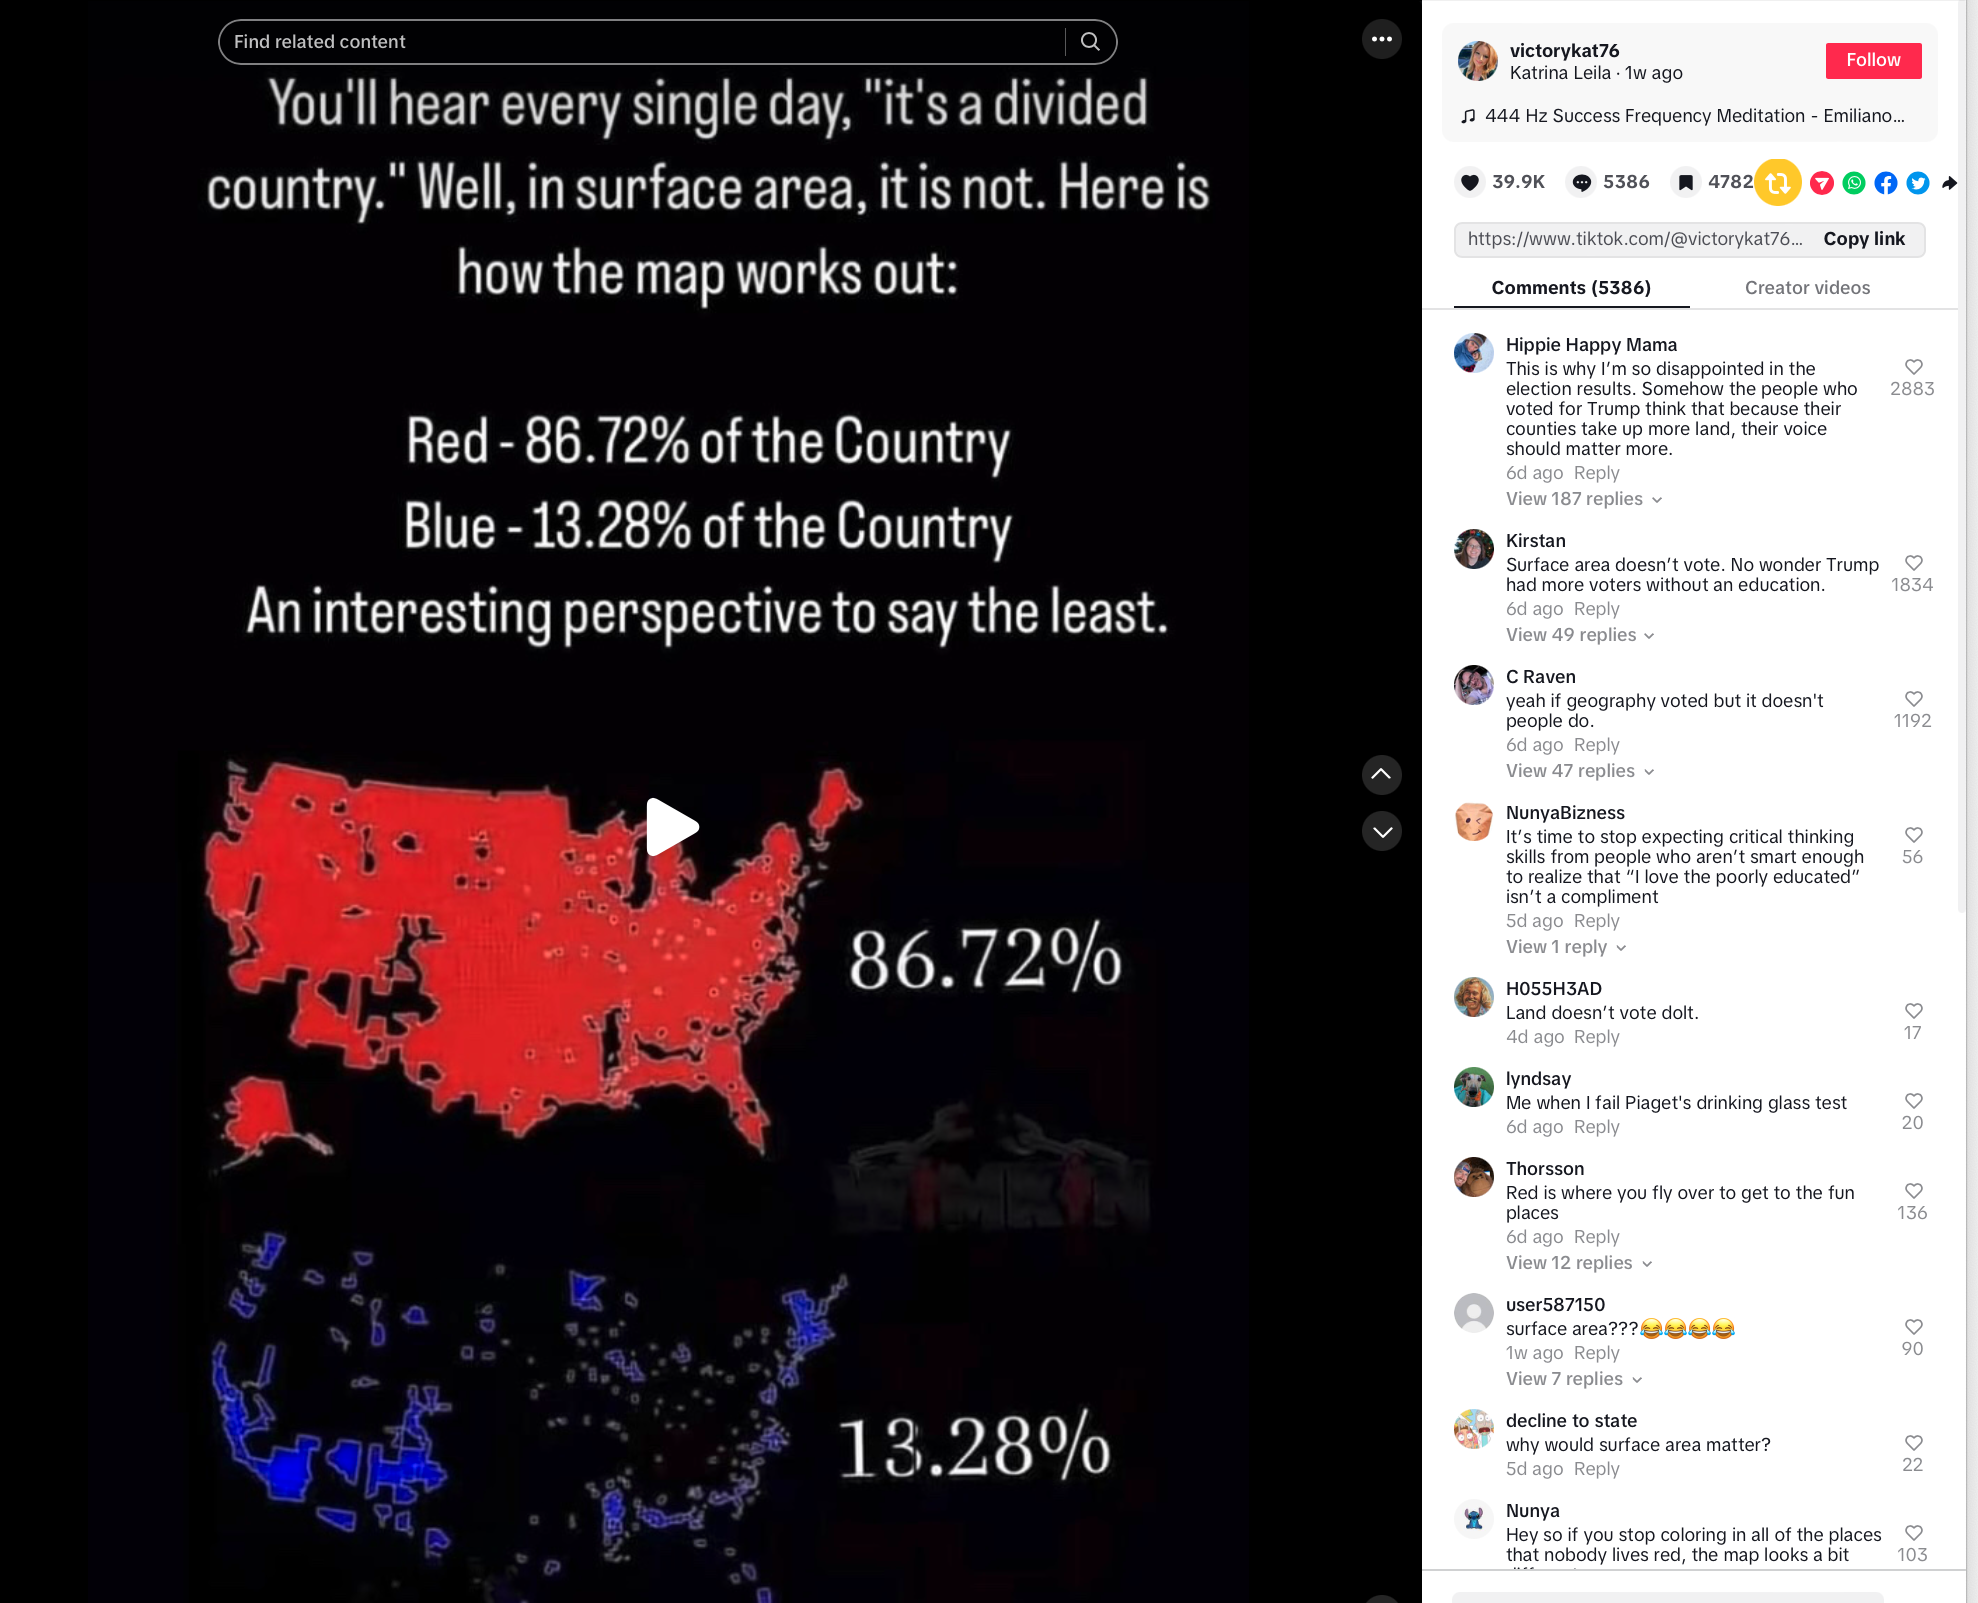
I cannot verify that the percentages are accurate. I do not know where they came from. I did go to the original post on TikTok which I will show below. Before that, let’s talk about one specific case study: California.
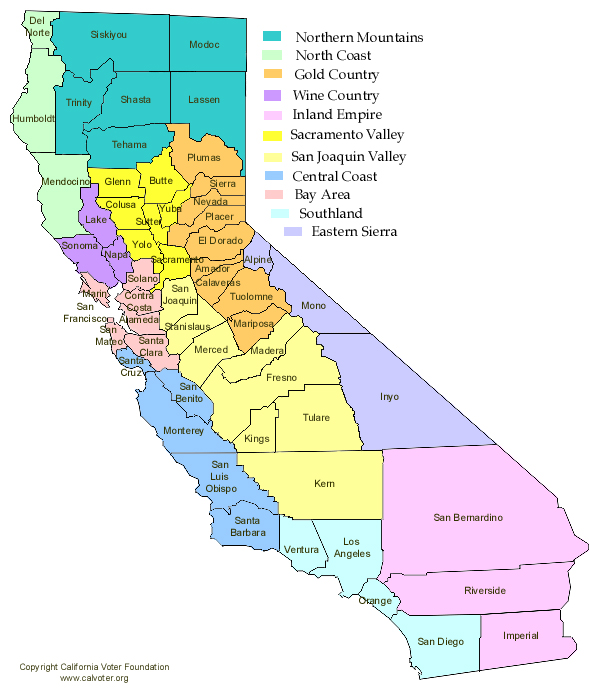
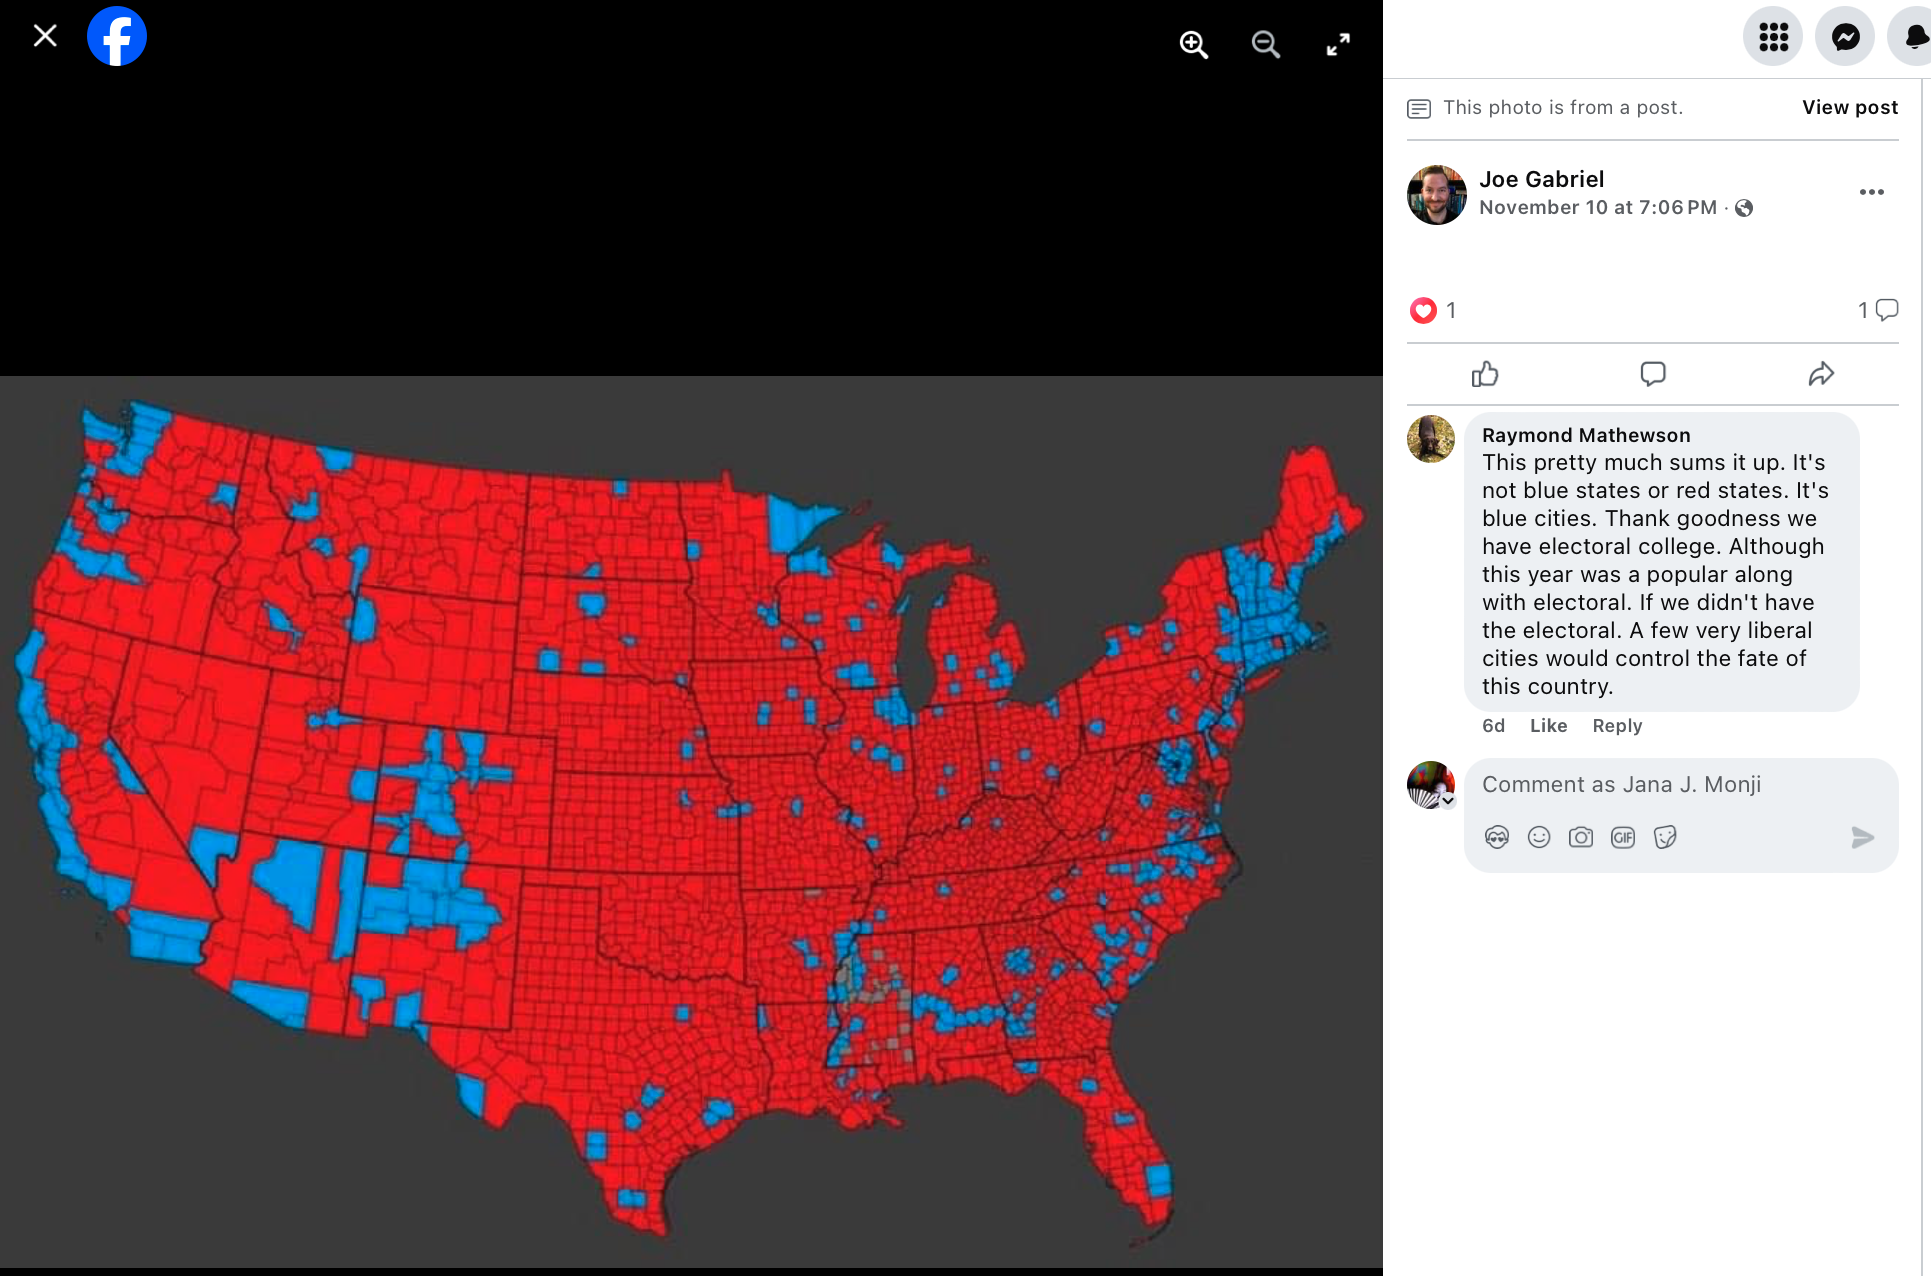 I believe the above map derives from this map which divides the US into voting districts and designates red and blue. From this, to better define the regions, I found a voter map from the California Voter Foundation. Looking at one of the light aquamarine blues, you’ll easily identify Los Angeles. You can see that Los Angeles is smaller than Inyo and San Bernardino. Inyo and San Bernardino voted red. Los Angeles voted blue. Does that mean more people voted red?
Inyo County, California is 10,197.3 square miles of land. It is the second largest county in California by total area. According to the US Census Bureau, it has a total population of 19,016. A great deal of the area is Death Valley National Park. 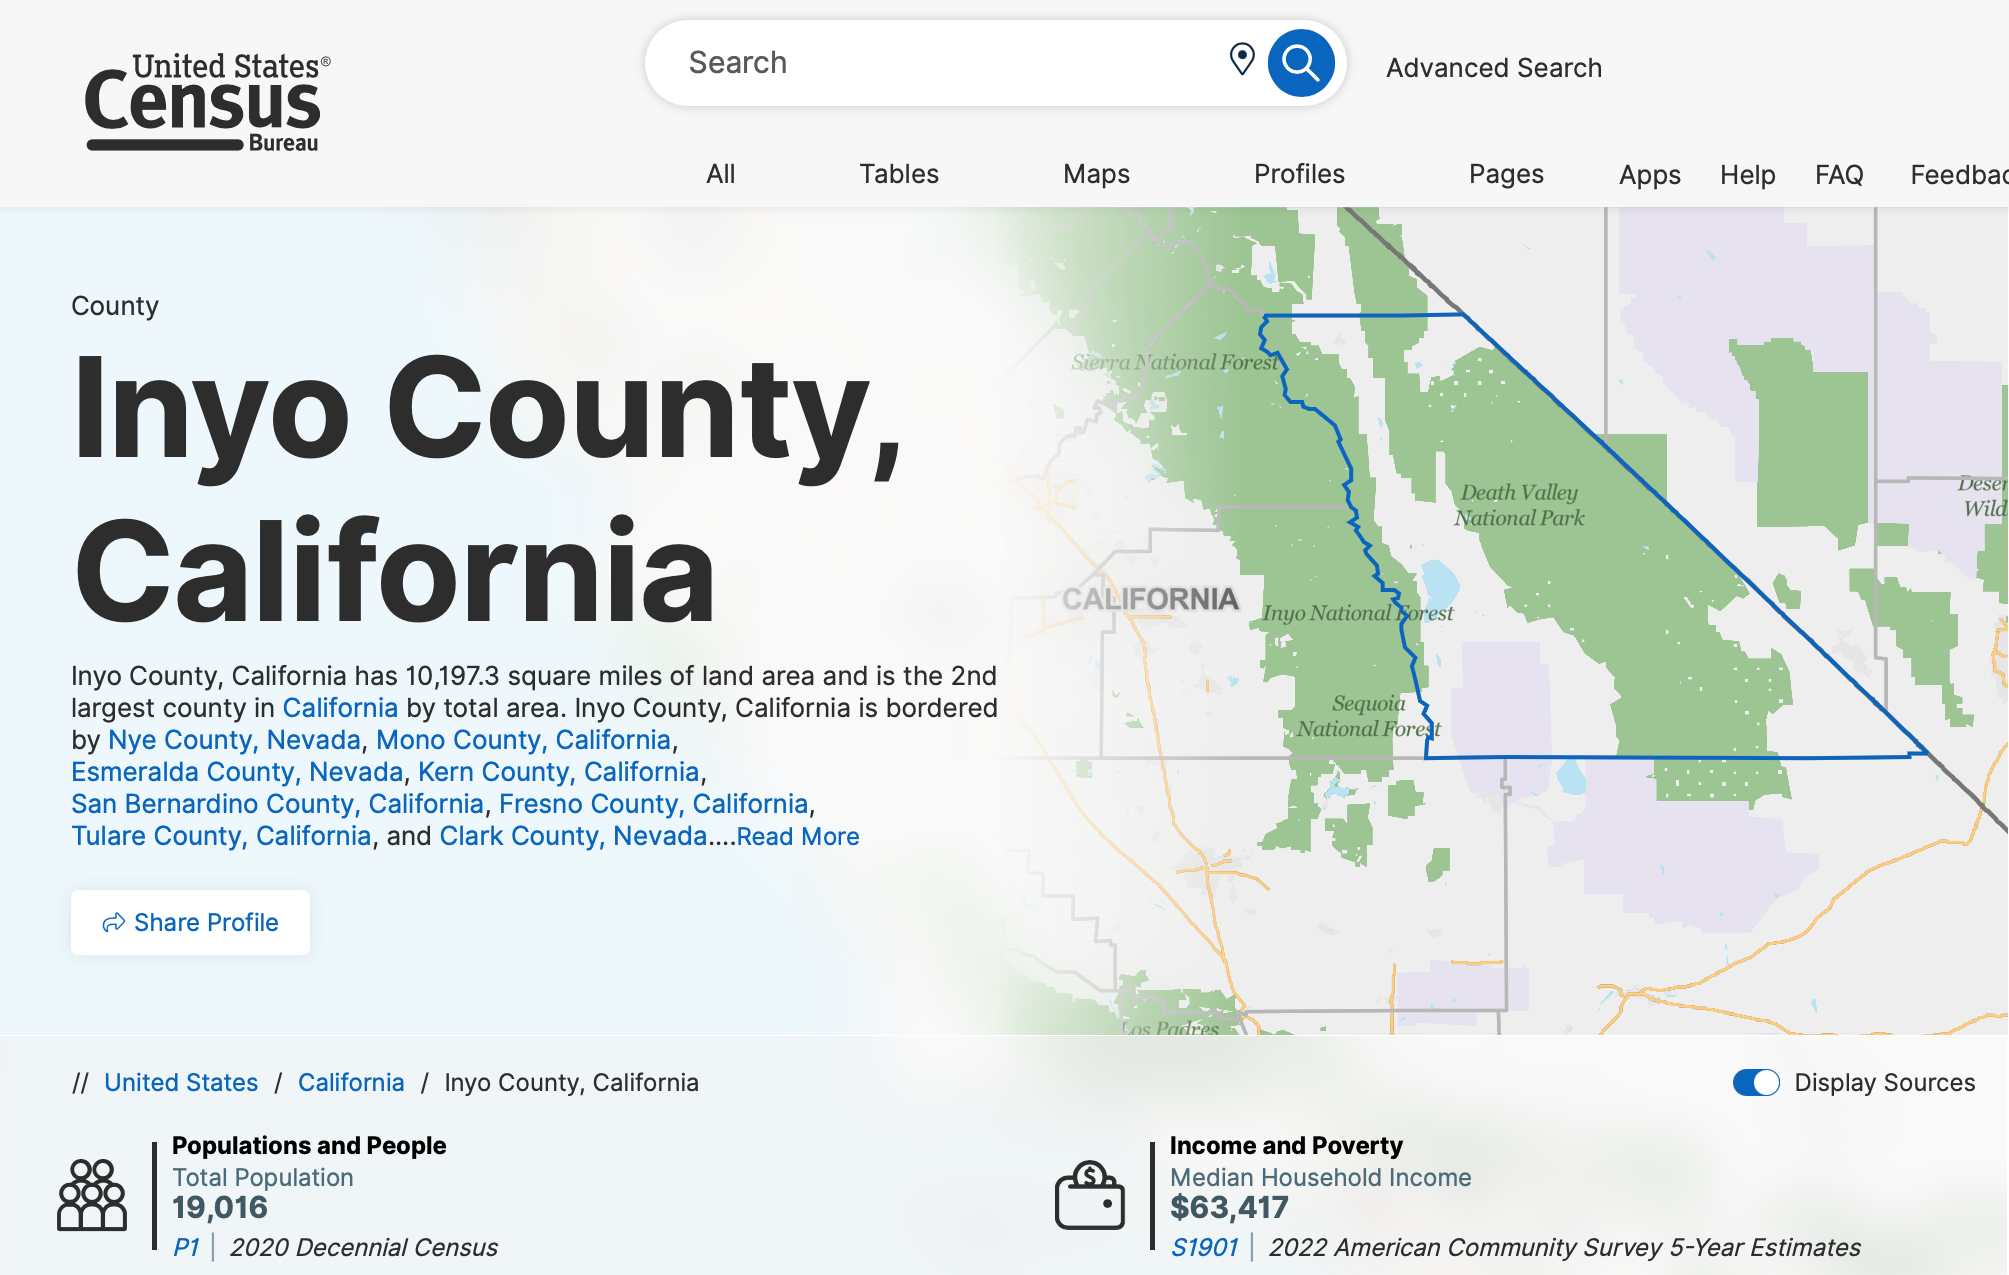
The total population of San Bernardino County is 2,181,654. San Bernardino County is 20,068.2 square miles. It is the largest county in the US by area.
The total population of Los Angeles County is 10,014,009. Los Angeles County is only 4,060.2 square miles. It is the 11th larges county in California by total area.
The total population of San Bernardino County and Inyo County combined is 2,200,670. That’s still less than Los Angeles County or only 22% of Los Angeles County’s total population.
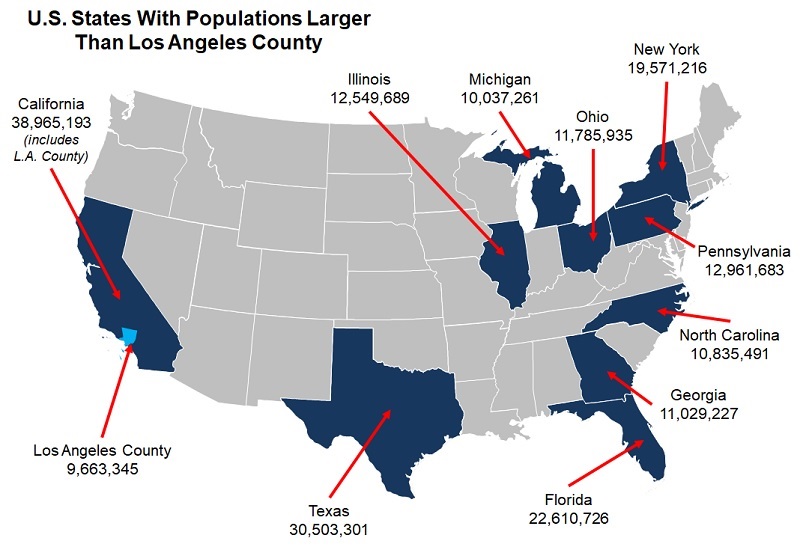 The LA Almanac has the Los Angeles County population at 9,663,345 in 2023. With that, it shows that only 11 states, including California, have a population larger than Los Angeles County. That would be California, Texas, Illinois, Michigan, Ohio, New York, Pennsylvania, North Carolina, Georgia and Florida.
In area, Los Angeles County is larger than Rhode Island and Delaware. The LA Almanac also states that Los Angeles County has “a larger economic Gross Domestic Product (GDP) than all but five U.S. states (California, Texas, New York, Florida, and Illinois).” That means the people in Los Angeles County voting for Democrats represents more people than all of Montana (1,084,225 ) or Wyoming (576,851). Even together with 1,661,076, Los Angeles County has more people (8,352,933).
People pointed this out on the TikTok post as well with comments like “yeah if geography voted but it doesn’t people do” or “Land doesn’t vote dolt” or “why would surface area matter?”
If you have other facts that contradict this, please let me know.
